Online map reveals local warming from tropical deforestation
A new interactive map reveals how deforestation is driving dangerous local warming across the tropics — with implications for health, agriculture, and climate resilience.
Tropical forests are often called the lungs of the Earth, but they’re also its air conditioners. When trees are cut down, the cooling benefits they provide – through shade and evapotranspiration – disappear too. The result? Rising local temperatures in and around the very places where forests once stood.
 Now, a new interactive map developed by researchers at the University of Leeds makes this local warming visible. It shows how deforestation in tropical regions could cause local temperature increases of up to 5°C, which could have serious consequences for people living nearby.
A Tool for Local Action
The map allows users to explore the impact of forest loss on local temperatures across tropical regions. Whether you're a policymaker, a conservation NGO, a farmer, a researcher, or a concerned member of the public the tool helps answer a critical question:
“If we lose forest in my local area, how much hotter will it get?”
“If we protect our forests, how much warming can we avoid?”
This is the first tool of its kind to provide locally relevant climate data on tropical deforestation. It’s designed to support decision-making at all levels — from national climate adaptation plans to community-led conservation efforts.
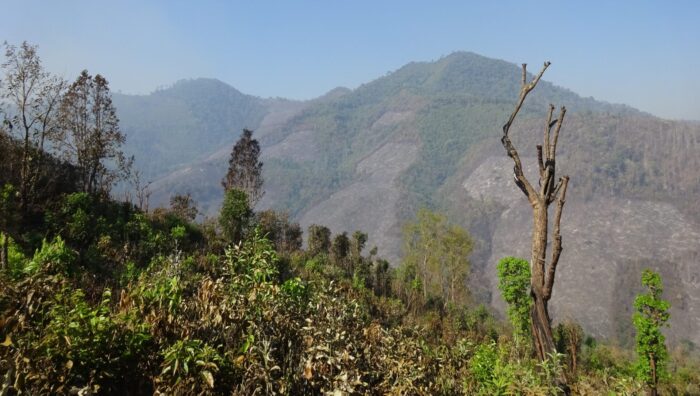
Deforestation in Chiang Mai, Thailand where deforestation could result in local warming of around 1.2°C. Credit: Carly Reddington, University of Leeds, UK.
The Science Behind the Map
The interactive map shows the direct, local warming that is caused by the loss of tropical forests that regulate temperature through evapotranspiration, shade and air turbulence. This local warming is in addition to the warming from global climate change caused by greenhouse gas emissions.
The map focuses on tropical forests because research shows they play a greater role in local cooling than temperate or boreal forests — thanks to their higher rates of evapotranspiration and more efficient surface energy redistribution.
The map is based on research recently published in Nature Climate Change, which found that tropical deforestation has already exposed over 300 million people to increased heat and is associated with 28,000 heat-related deaths each year. Dr Carly Reddington from the School of Earth and Environment, who led the study said:
“This warming not only has the potential to adversely affect human health, but also water security, food production, livestock health, and labour productivity – especially for vulnerable communities across the tropics.”
Insights from the Map
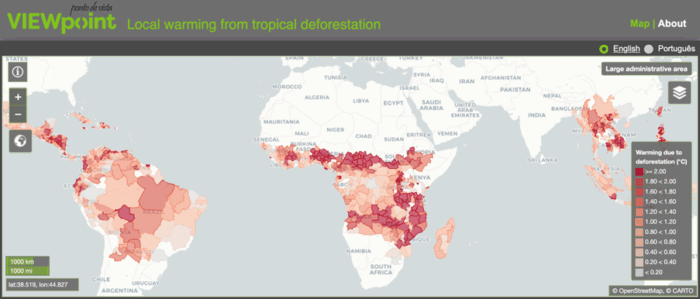
The interactive map shows the estimated local temperature increase caused by different levels of deforestation per region, district, or province. Deforestation could cause local warming of:
- more than 2°C in Rondônia, Brazil and Lampung in Sumatra, Indonesia,
- more than 5°C in Katavi Region, Tanzania,
- more than 3°C in many other parts of Latin America, Southeast Asia and Africa.
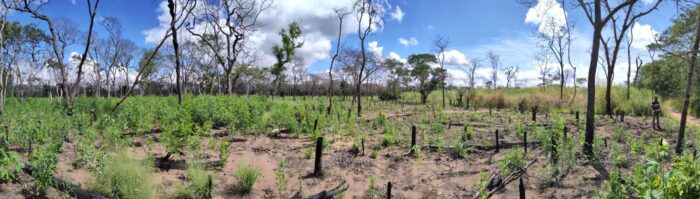
Deforestation in Nachingwea District, Tanzania where deforestation could result in local warming of up to 3.8°C. Credit: Nike Doggart, University of Leeds, UK.
The interactive map highlights the need to protect and sustainably manage all types of tropical forest, not just the most pristine, densely forested areas. It reveals the removal of tropical forests with intermediate canopy cover – including logged or partially deforested regions and naturally occurring biomes like the miombo woodlands in south-central Africa – can still lead to substantial local warming.
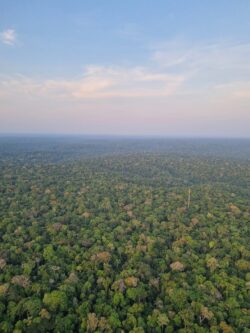
Forest canopy in Amazonia, Brazil. Credit: Dominick V. Spracklen, University of Leeds, UK.
Why It Matters for COP30
As world leaders prepare to gather in Belém, Brazil for COP30, the map offers a timely reminder:
Tropical deforestation is not only contributing to global climate change through CO₂ emissions — it’s also directly warming surrounding areas and increasing heat-related health risks.
As global climate change intensifies, extreme heat will become more frequent and severe, particularly in deforested areas that lack the cooling benefits of trees. We have already seen episodes of extreme heat and prolonged drought in places like the Brazilian Amazon in recent years. Global climate change combined with local warming from continued deforestation in the tropics will have severe consequences for millions of people. And with populations in tropical regions projected to grow, even more people will be exposed to dangerous heat in the future.
Dr Nike Doggart from the School of Earth and Environment, who led the development of the map, said:
“We hope that by understanding how forests moderate temperatures at the local scale, policymakers may give greater priority to forest protection and reducing deforestation.”
Explore the Map and Take Action
The tool is user-friendly, available in English and Portuguese, and hosted by the Met Office on its VIEWpoint platform.
Visit the map here or click the image below.
Whether you're attending COP30 or working on the ground in a tropical country, this tool offers a powerful way to connect local action with global climate goals.